前言
最近需要用到python来绘制热图(斑图, 色度图),查阅资料之后发现主要使用matplotlib库中的imshow函数来实现。
函数参数解析
matplotlib.pyplot.imshow(X, cmap=None, norm=None, aspect=None, interpolation=None, alpha=None, vmin=None, vmax=None, origin=None, extent=None, shape=
, filternorm=1, filterrad=4.0, imlim= , resample=None, url=None, *, data=None, **kwargs)[source]
X: array-like or PIL image(数组或者是图片)
cmap: str or Colormap(颜色映射)
norm: Normalize(标准化到(0, 1)区间)
aspect: {‘equal’, ‘auto’} or float(控制轴的纵横比)
interpolation: str(插值方法),可选为( ‘none’, ‘antialiased’, ‘nearest’, ‘bilinear’, ‘bicubic’, ‘spline16’, ‘spline36’, ‘hanning’, ‘hamming’, ‘hermite’, ‘kaiser’, ‘quadric’, ‘catrom’, ‘gaussian’, ‘bessel’, ‘mitchell’, ‘sinc’, ‘lanczos’.)
剩下的具体参数解释可参考文档解释
实例
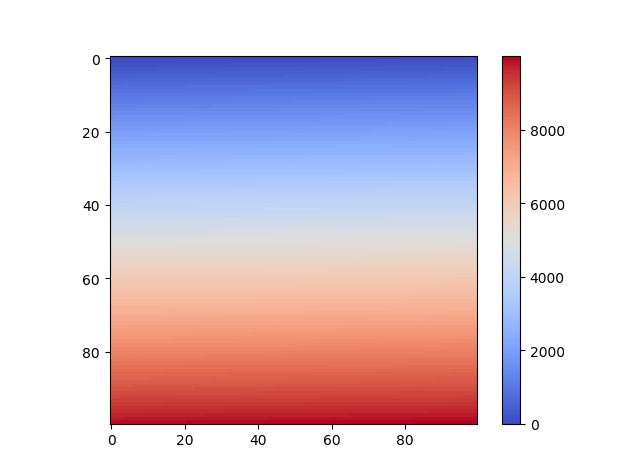
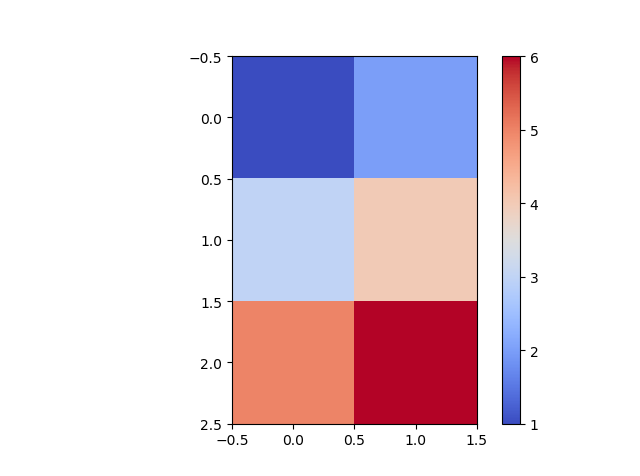
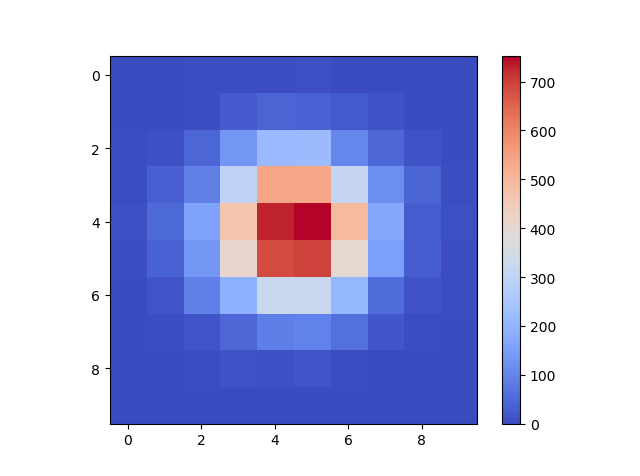
默认使用nearest插值方法
example 1.
1 | import matplotlib.pyplot as plt |
example 2.
1 | X = [[1,2],[3,4],[5,6]] |
example 3.
1 | mean = [0,0] |
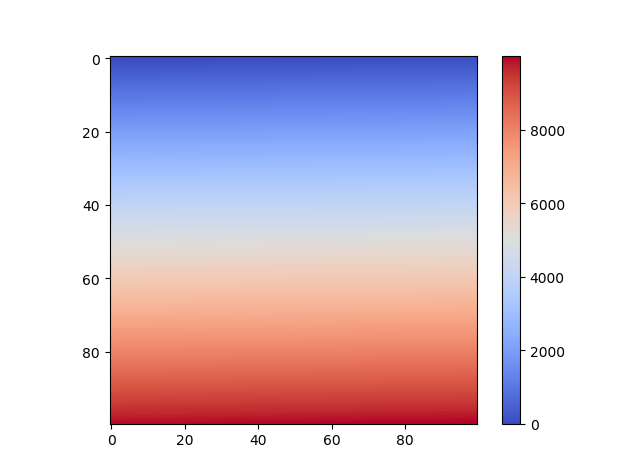
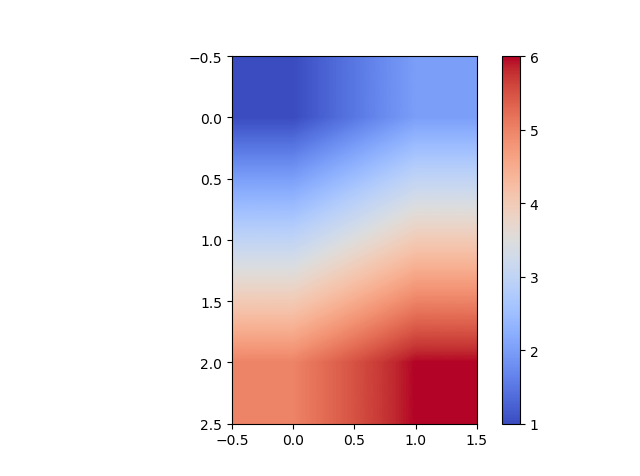
使用bilinear插值法(当然可选插值方法还有很多)
example 1.
1 | arr = np.arange(10000).reshape(100, 100) |
example 2.
1 | X = [[1,2],[3,4],[5,6]] |
example 3.
1 | mean = [0,0] |
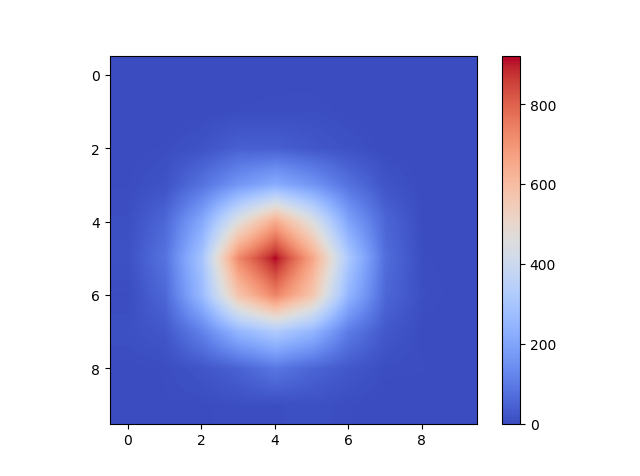
可以对比使用或者不使用插值方法时生成图片之间的区别。以上是比较简单的示例,例如颜色的渐变,数值的标准化等都没有涉及到,需用用到时可详细参看文档解释
拓展
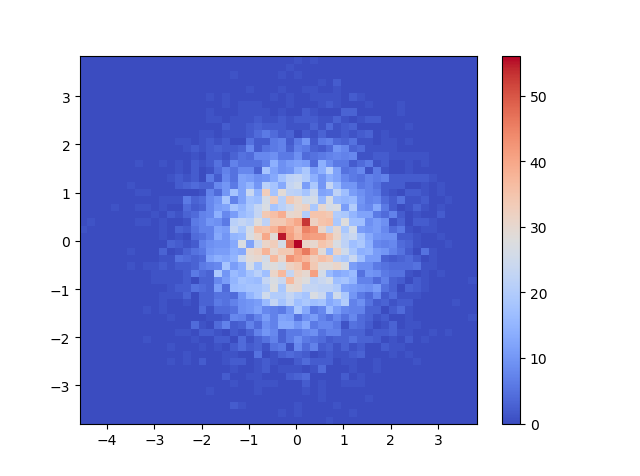
针对上面两个example 3. 我们也可以使用hist2d函数(当然还有其他的实现,例如pcolor,matshow函数等)
1 | mean = [0,0] |
总结
python中生成热图的主要方法为imshow()函数,我们看到同样还有很多其他的方法可以实现,他们可以满足不同的画图需求,本文中涉及的函数主要是matplotlib库中的,同样在seaborn中也有热图函数,比如heatmap,本文中介绍的热图函数已经能够满足大多数时候的需求。